Attorney Molly Phelan on how to reduce property tax liability.
Office property owners may feel they are getting squeezed from all sides in 2022, but the right strategy can help them turn lemons into lemonade by reducing property tax liability.
The Bad News: Inflation was up 7.1 percent year over year in December, its highest rate since 1982.
The Culprits: Supply chain issues (raw material shortages, seaport congestion and logistic limitations), labor shortages (general wages up 5 percent, retail wages up 15 percent), and a housing shortage (national apartment vacancy at 2 percent and average rent growth above 15 percent year over year).
The Response: The Federal Reserve signals a shift to tightening monetary policy, indicating future interest rate increases.
The office market is facing headwinds of its own. Numerous corporations have announced permanent shifts to hybrid in-person/work-from-home operations for office staff, significantly decreasing demand for office space. Rental rates have dropped anywhere from 5 percent to 33 percent during the pandemic, depending on market and class. Although Manhattan rents for Class A space have increased 2 percent in the past year, the net operating income for these properties is down 7 percent due to increased costs and lease concessions.
In the Midwest, office landlords previously expected to provide one month of free rent per year to woo tenants. Now brokers are reporting a free rent ratio of 1.6 months per year, with leases over 10 years pushing two months per year. Tenant improvement costs have increased approximately 44 percent since the beginning of the pandemic, and turnaround time for occupancy has increased from 30 days to 60 days.
Farther down the balance sheet, things aren't much better. Energy prices tracked in the S&P Goldman Sachs Commodity Index ended 2021 59 percent higher than in the beginning of the year. Labor costs, from janitorial staff to property managers, have increased as well.
The Good News: Although the market has handed office landlords a bucket of lemons that are putting downward pressure on average net incomes, landlords can make lemonade from this data to significantly reduce their real property tax liabilities, even if their NOI has not yet taken a hit.
The Strategy: Pivoting from a direct capitalization value analysis to a discounted cash flow approach can capture the effects of investor outlook data on a property's market value. Appraisers and assessors who value office properties typically figure direct capitalization in their income analysis to estimate fee simple market values. This is standard practice in stabilized markets but is a poor fit to current conditions.
With the dramatic changes and uncertainty in the office market, appraisers should be conducting discounted cash flow analyses, which identify the market conditions investors are anticipating as of the valuation date. The DCF analysis examines the market like an investor would, considering trends such as rental rate reductions and increases in operation costs and vacancy. These factors are then built into pricing models.
Savvy investors are aware of a sleeping giant that few assessors or taxpayers are identifying, and that is shadow vacancy. While landlords are still collecting income on current leases, there is no reflection of the market's precarious situation in their income. A DCF, however, identifies upcoming vacancy and reductions in market rents, which may have a significant effect on NOI.
Methods Compared
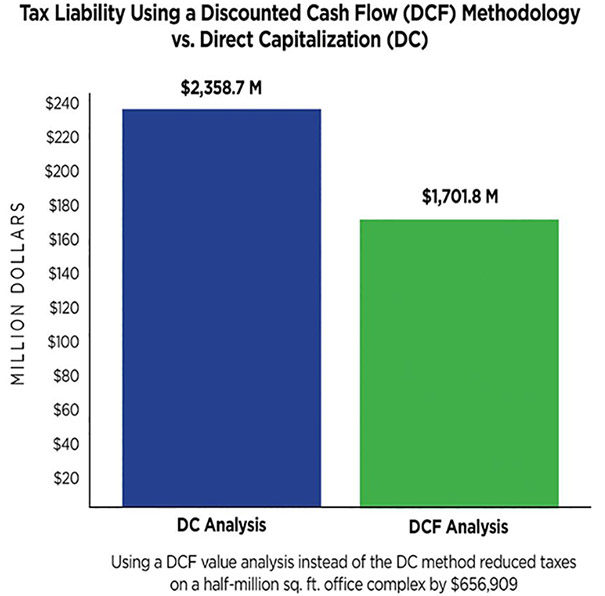
Let's compare the two approaches, beginning with a look at direct capitalization applied to a 500,000-square-foot office complex. As of Jan. 1, 2022, its tenants are paying $25 per square foot in net rent, or a maximum $12.5 million in annual attainable rent. Stabilized vacancy is 8 percent and operating expenses are 20 percent, or $2.3 million annually. A capitalization rate of 6.5 percent indicates a market value of $141,538,462. In Illinois, outside of Cook County, an assessment level of 33.33 percent and a tax rate of 5 percent equates to a tax liability of $2,358,738.
By contrast, a DCF model would also reflect that market rent has dropped to $23 per square foot, reducing the asset's revenue capacity to $11.5 million per year. It would show that market-wide vacancy is expected to rise to 12 percent, that expenses have increased to 27 percent, and that the subject property has 100,000 square feet offered for sublet at $20 per square foot. Additionally, 20 percent of its leases mature in the next two years and a total of 50 percent of its leases will end within five years.
Paired with the estimated increases in interest rates as indicated by the Federal Reserve, the cap rate could easily increase to 7.5 percent for the specific property. The DCF analysis using these factors indicates the market value is $102,120,000 and the taxes are reduced to $1,701,830. The difference in tax liability is $656,909, or a reduction to the tenants of $1.31 per square foot in tax pass throughs.
Commercial real estate investors across the board rely on the discounted cash flow model, but few taxpayers or their advisors use the strategy in contesting property assessments. Given the additional information and analysis required to perform the analysis, not all appraisers can properly construct a credible discounted cash flow model.
For success, it is critical that both the taxpayer's advisor and appraiser be able to knowledgeably discuss the differences between the two models, and in an assessment appeal, be able to explain why the discounted cash flow model is a more reliable methodology in this market.
To remain competitive, landlords must reduce occupancy costs for tenants and their own holding costs as they take back more vacant space. Even if an assessment has been lowered or remained stable over the past few years, having a credible team provide an alternative view can offer a competitive advantage moving forward.


